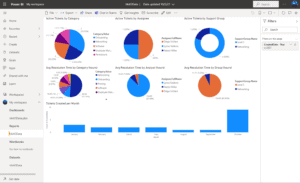
This is blog is part 2 in a 2-part series designed to help you create dashboards using your ticketing data. In part 1, we showed you how to use our Power BI Template for quick visuals. In part 2, we’ll get more creative charting results by creating custom dashboards.
Sometimes a dashboard template can help you quickly illustrate specific scenarios or data patterns. But more often than not, you need a collection of charts that speak specifically to your organization’s key interests and results. That’s why custom dashboards may be a better fit. Let’s walk through the process of building them.
Got Ticketing Data? Let’s Chart It
Previously, we covered:
- Obtaining an authentication token
- Downloading our Power BI Template
- Using Power BI Desktop
And at this point, we’re free to drag any of our Tikit data into our canvas and build custom charts. Let’s start with “Tickets by Requester Department.” To do so, let’s make sure we have “Requester.Department” and “Title” as our Values. Just expand “Ticket_table” over on the right and check these fields off. You should see a table that looks like this:
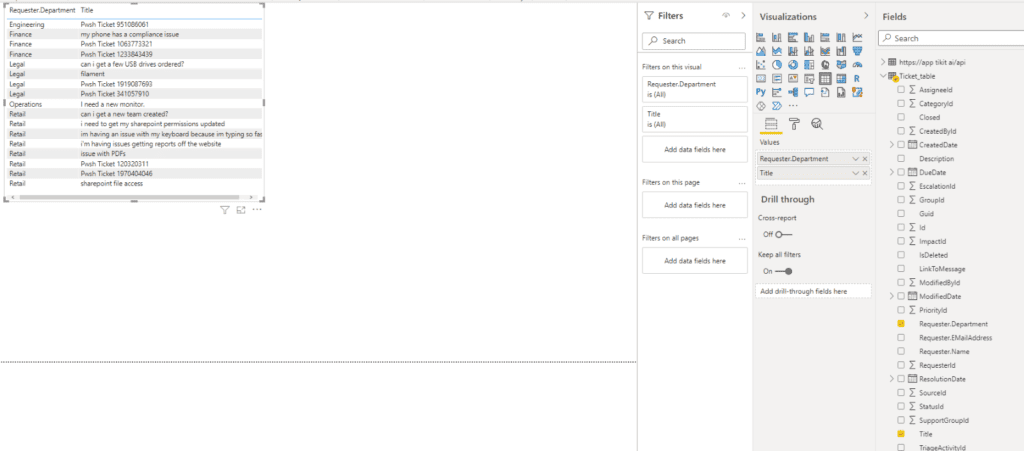
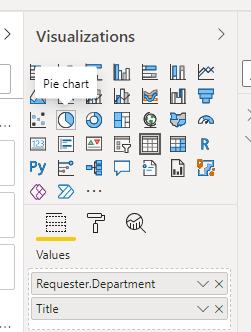
But what we want to see is a count of tickets for each of our Requester Departments, instead of seeing every single individual ticket by department. To make this change and move data from a table to a pie chart, all we have to do is click on “Pie Chart.”
This may render a rather empty looking pie chart. The chart’s legend is there, but the actual graph is still missing.
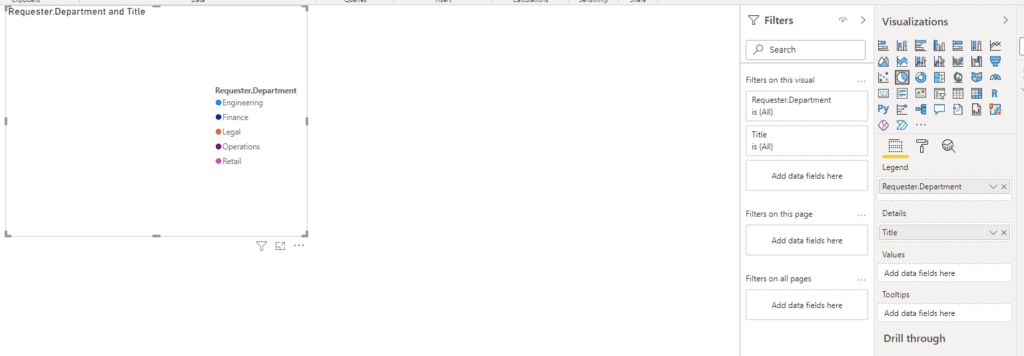
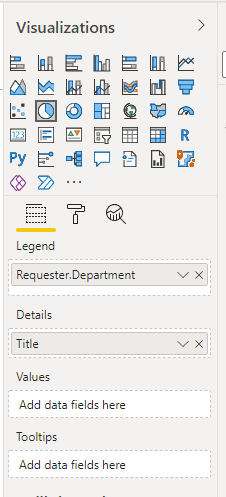
That’s due to the layout of pie chart fields. Our Legend is the “Requester.Department,” but we haven’t set our Values to anything. Fortunately it’s as easy as clicking and dragging “Title” from the Details section into the Values section.
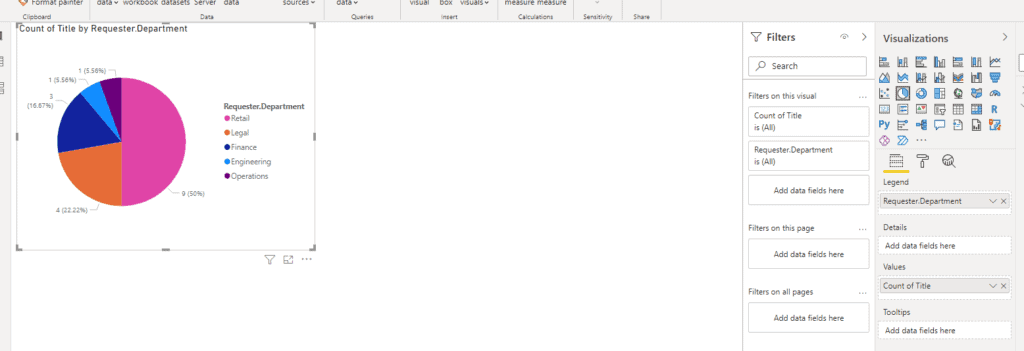
And just like that: charted!
We can repeat this process as many times as we need to build new charts and visualize data in new and different ways. Then once you’re ready you can…
Publish Dashboard to Microsoft Teams
With our dashboard now populated, we can publish it to Power BI Online. This will let us schedule automatic data refreshes and build brand new reports without Power BI Desktop. It also gives us the ability to publish dashboards right inside of Teams. We could include the Support Team, or perhaps a specific Channel within our Support Team. Let’s give it a shot.
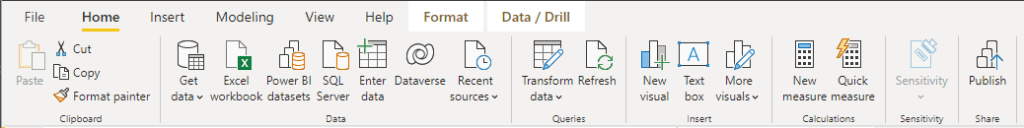
In the Home tab of Power BI Desktop, click “Publish.”
Once you sign in with your 365 credentials, you’ll be asked where you want to publish. You can choose your own Power BI Workspace or an already existing Workspace you’ve shared with others.
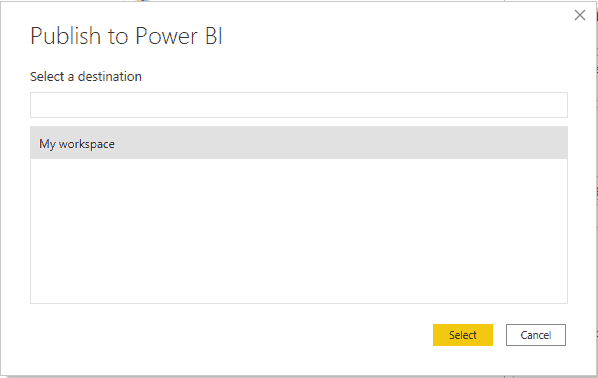
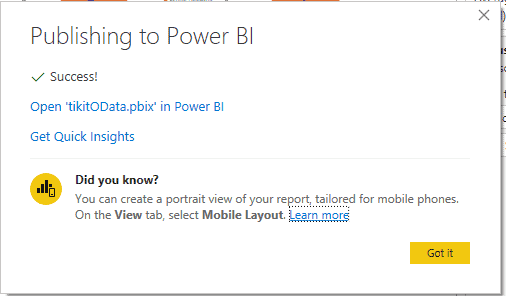
Once you’ve chosen your desired Workspace click “Select.” You’ve successfully published your dashboard! To view it online, click on Open in Power BI.
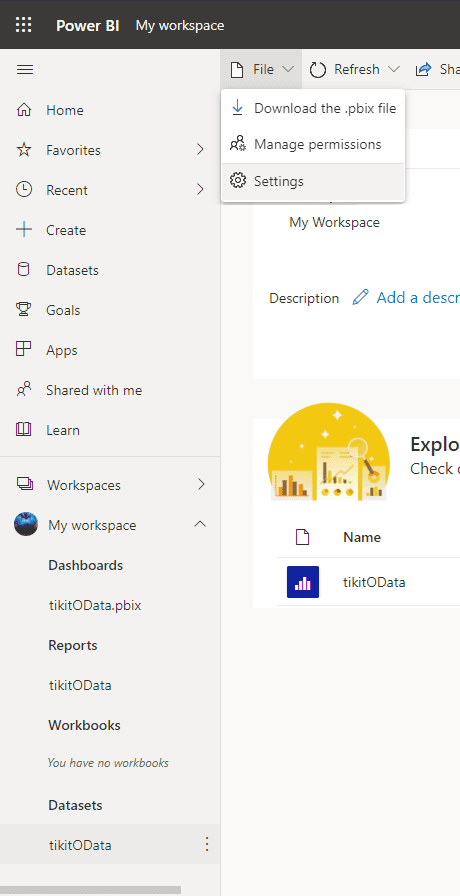
Now that your report, dashboard and dataset have been uploaded to Power BI Online, we can configure automatic data refreshes. As your team works tickets, your dashboards will automatically update with new data.

Just select the name of your Dataset and choose “Settings.”
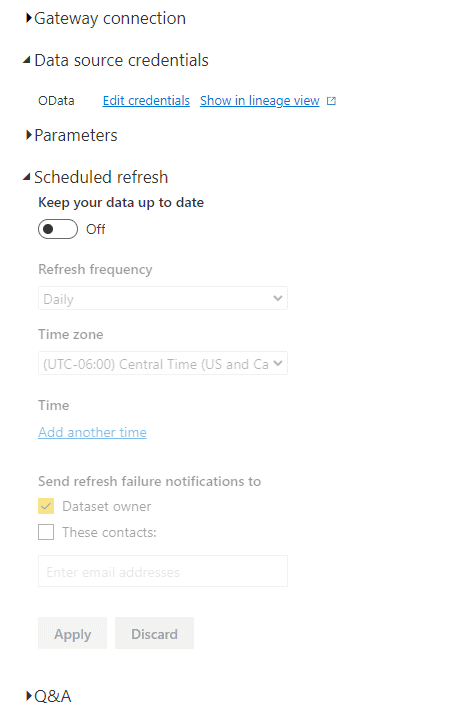
It’s here in Power BI Online that we can enable Scheduled Refreshes and update our Authentication Token through Parameters when the time comes.
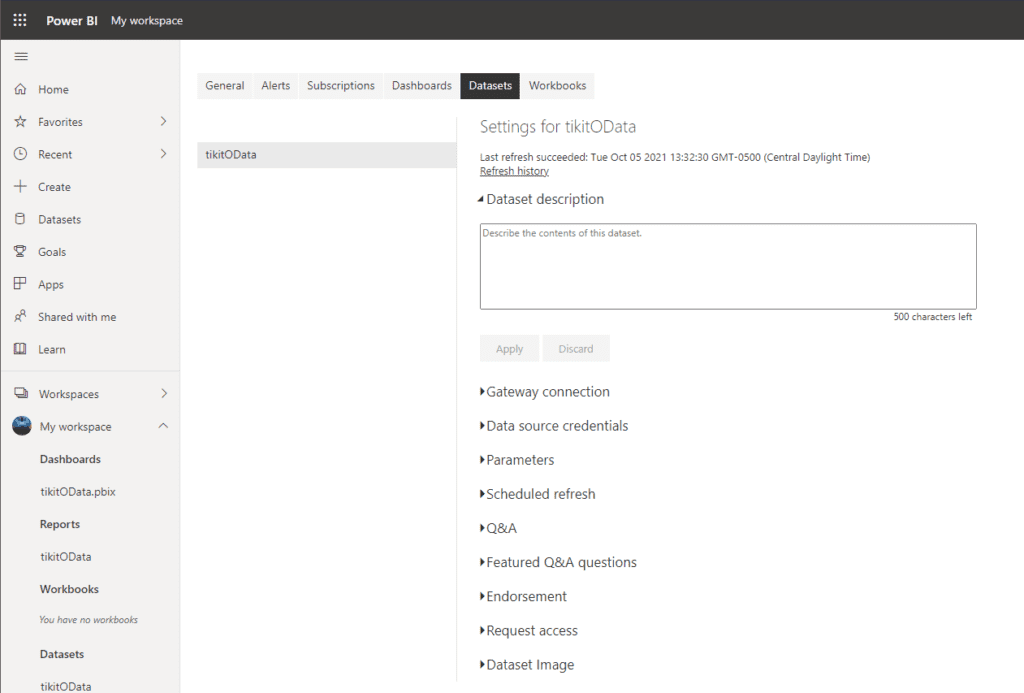
Just expand “Scheduled Refresh,” “Data Source Credentials” or “Parameters” to configure.
Now let’s head back to Teams and navigate to any one of our Channels within our Support Team.
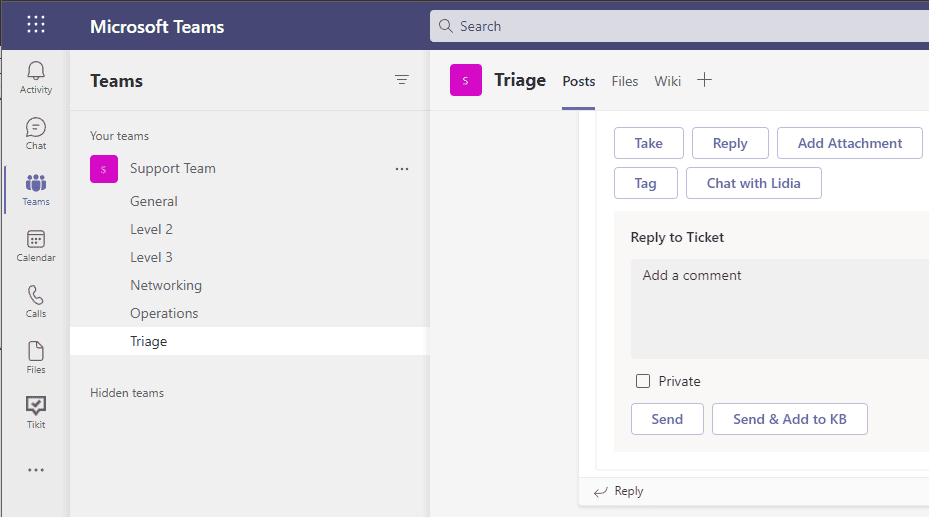
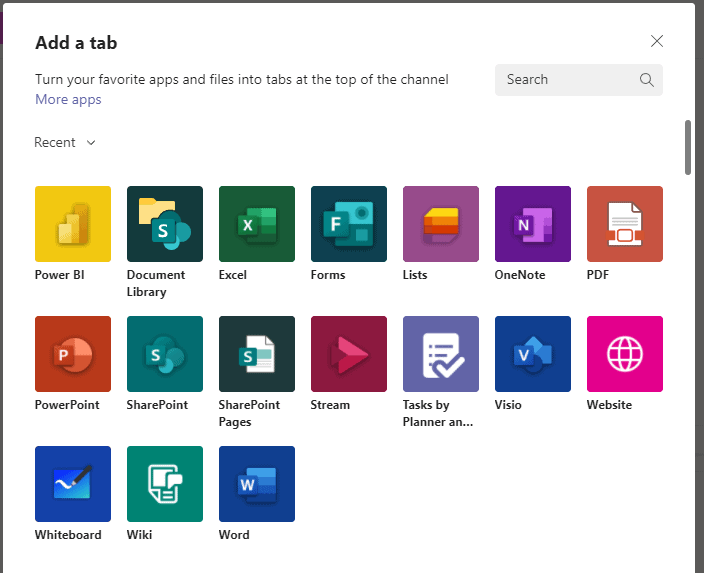
In the top row where you see Posts, Files and Wiki, click the “+ icon.” Then select “Power BI.”
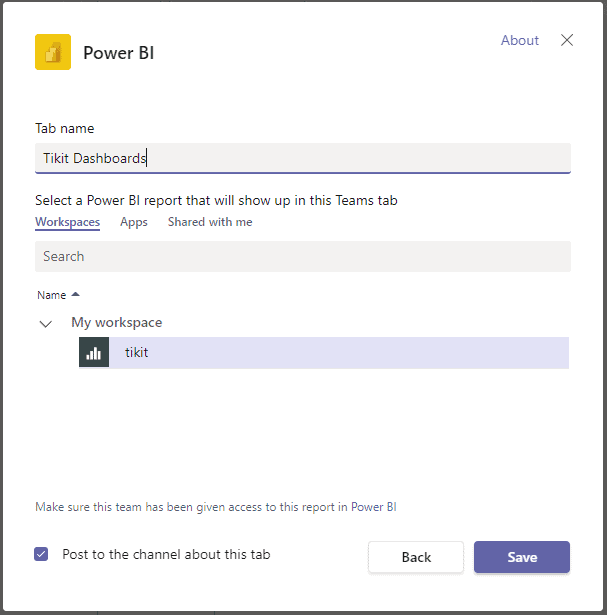
You should be able to find your workspace and your previously-uploaded report. You can name this Tab (example: Tikit Dashboards) and optionally choose to automatically post a message to the Channel about the new tab. Finally, click “Save.”
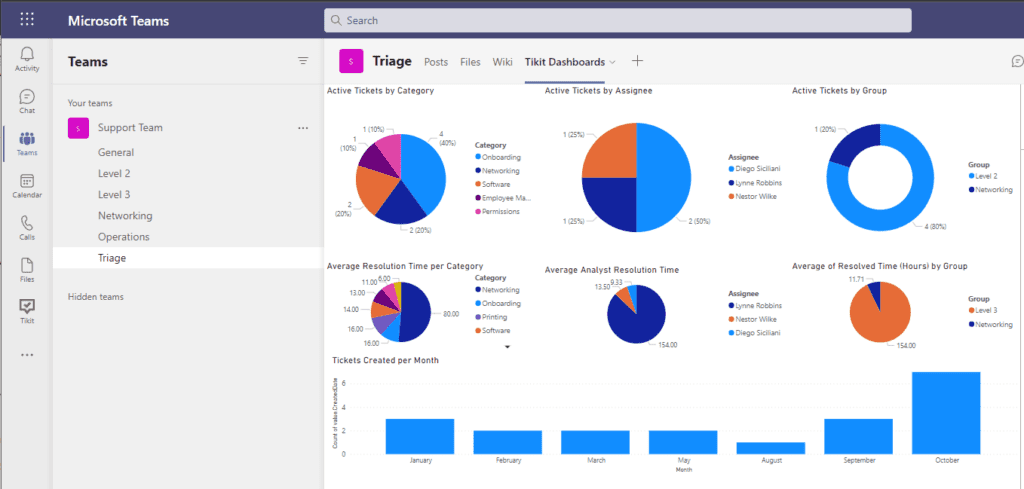
Now you have Tikit Dashboards in Teams that automatically refresh. You can change and update them as you see fit and place them in any other Teams or Channels.
Part 1 of our dashboard series is How to Create a Ticketing Dashboard in Microsoft Teams using Power BI. Wondering what else you can do using Tikit? Check out this guide, which breaks down Tikit’s functionality, backstory and the value of building a service desk in Teams: How Microsoft Teams Inspired Our Microsoft Teams Service Desk Solution. You can see how Tikit works in this demo. Or better yet, explore Tikit in a free 14-day fully-functional trial with no credit card needed!