
This blog is an update to our original Power BI reporting series posted here.
Whether you’re new or joined us within the last two years, Tikit has grown in its capability and feature set. With those changes, it only makes sense to update our Power BI dashboard giving you a simple way to get started with reporting fast.
Just like before, we’ll need an Access Token which we can generate at https://web.tikit.ai. Learn about Access Tokens here.
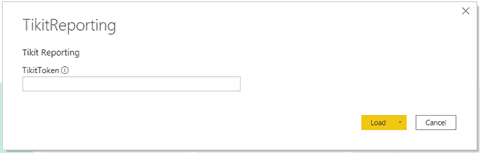
With our token, let’s open v2 of our Power BI Template with Power BI Desktop. Paste your key in and click Load.
(This template has been updated as of January 24, 2023. Anyone who previously downloaded should use this version.)
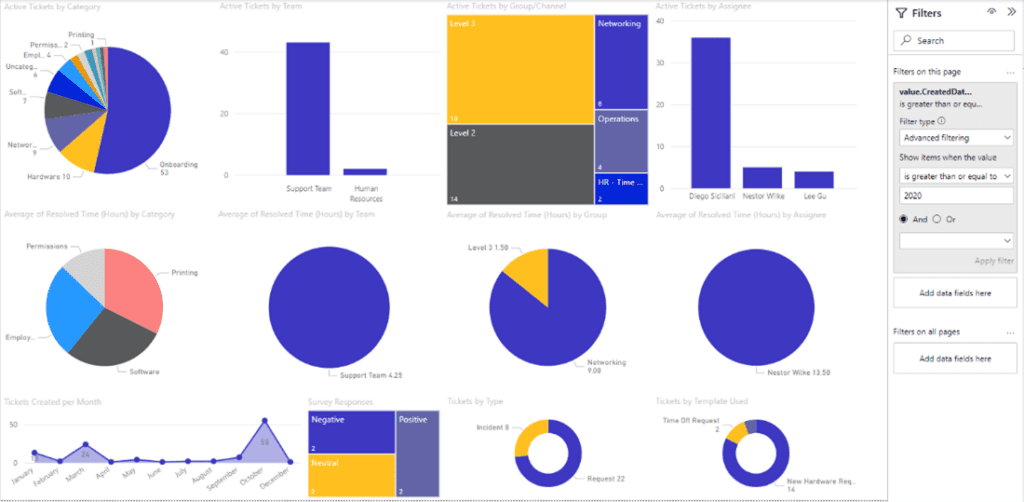
Just like before, your data is retrieved, charts render, but now we’ve made sure to collect data and build dashboards around other Tikit concepts we’ve introduced such as:
- Surveys to see your positive, negative, and neutral responses.
- Ticket Types to see another dimension of reporting.
- Teams so you can break down work when you’re using Multi-Department.
- Templates so you can organize data by which processes are being utilized the most.
With this Template you can see not only how we’ve retrieved data, but how we’re filtering to display these charts. Enabling you to copy, paste and modify to your needs quickly and easily.
Modifying Charts and Using Filters
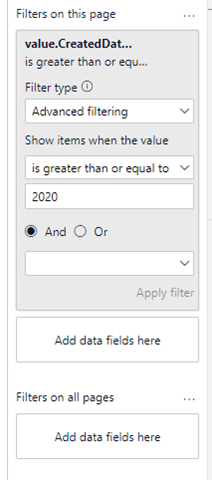
Power BI makes working with Tikit data easy and if not borderline magical at times. But something easy to overlook is how filters are applied to the Page vs. the individual graphs. In this template, we’ve baked in a Page Filter that says show every ticket created either during or after 2020.
Whereas if we were to click on “Active Tickets by Team” you’ll notice we get a combination of filters. The previously outlined page filter + the new chart level filter. To emphasize this, I’ve modified the photo to draw attention to the chart and the filters.
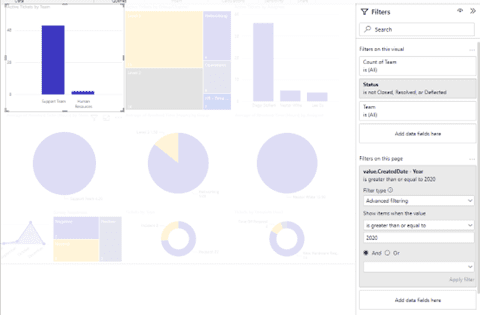
This holds true for pretty much every chart you see on the page. Charts can be filtered separately from the entire page. You’ll also notice though, there are filters that apply to every page should you choose. Just something to keep in mind as you build.
With this information you can create and modify this report to reflect information to your Teams on a daily, weekly, monthly, or year to date basis.
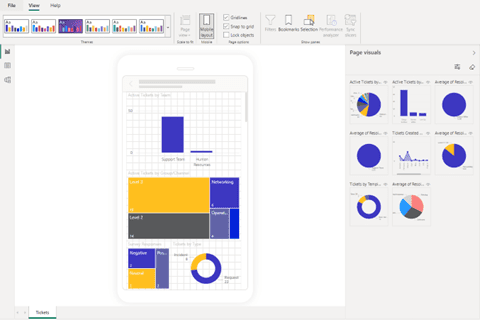
Power BI also includes a Mobile Layout designer that lets you build your own mobile view based on charts featured in your report. Giving you more ways to build once and use in as many places as you want.
If you have any questions or issues configuring your Power BI reporting with Tikit, please reach out to our support team at help@tikit.ai. To read part two in the original Power BI reporting series, find it here.
New to Tikit? Try Tikit in a 14-day free trial and schedule your free Setup call with a dedicated Tikit team member to ensure you are experiencing all that Tikit has to offer.