
This blog is an update to our original Power BI reporting series posted here.
We’ve made some updates to our Power BI Dashboard with support for improved error handling and the introduction of a new page dedicated to Service Level Agreements (SLAs) across your Tikit environment. Just like before, we’ll need an Access Token which we can generate at https://web.tikit.ai. Learn about Access Tokens here.
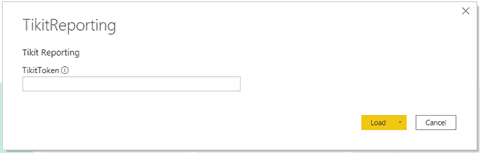
With our token, let’s open up the updated Power BI Template with Power BI Desktop. Paste your key in and click Load.
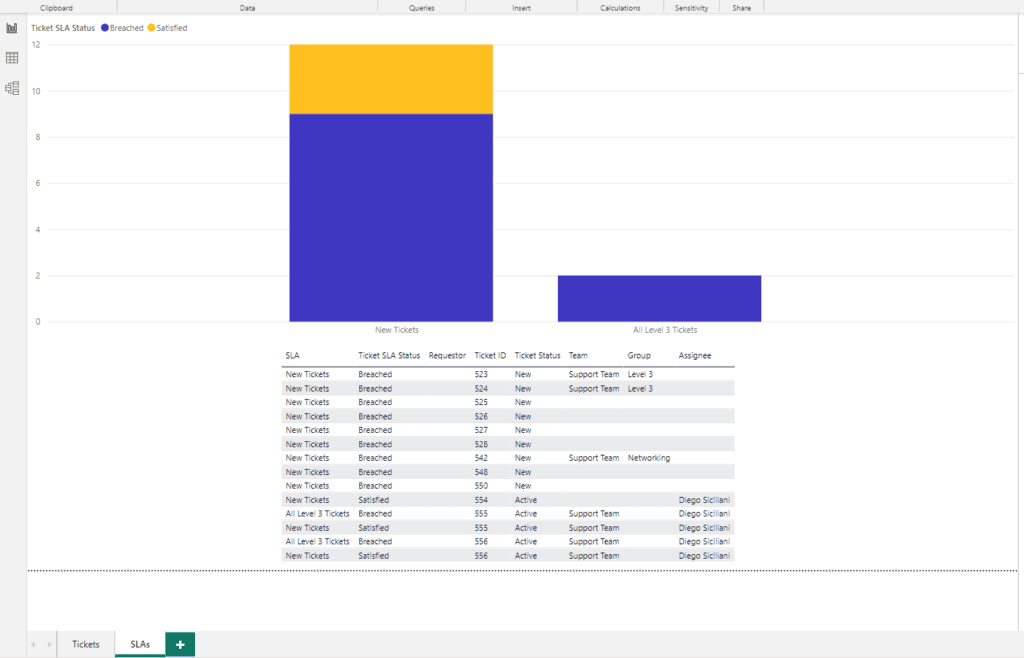
While the initial page you see may not look all that different from the previous dashboard, you’ll notice a wholly new page/tab dedicated to SLAs in the lower left hand corner. With the SLA Dashboard, you’ll be able to see all of your SLAs, all of the tickets associated with each of them and the count of all tickets within their respective SLA Status (About to Breach, Breached, Satisfied). There is also a breakdown beneath the graph that shows you the specific tickets associated with each SLA so you can quickly pinpoint and remediate any tickets that need attention. This also means that it’s possible you see the same ticket multiple times as it could have more than one SLA associated with it.
Updating Your SLA Filters
As always, we’ve included some out of box filters to get you started. But SLAs bring in a whole new dimension to reporting, so its worth explaining what these new datasets are in our report.
- Service Level Agreement: All of the SLAs that you’ve configured within Tikit. This includes Active and Inactive SLAs
- SLA Status: All of the possible Status values that an SLA can be such as Satisfied, Breached or Approaching Breach
- Ticket SLA: This represents the actual one or many SLAs that relate to Tickets within your environment. We’ve gone a couple steps further for you and added Service Level Agreement + SLA Status + Tickets into this dataset to make customizing dashboards as easy as drag’n’drop.
For example, maybe we really only want our SLA Dashboard to reflect just our “All Level 3 Tickets” SLAs. We can introduce a Filter to the entire Page to ensure our Stacked Column Chart and Table are both updated in a single go. We’ll just drag “Service Level Agreements.value.Name” from “Ticket SLA” into the “Filters on this page” and then select it.
If you have any questions or issues configuring your Power BI reporting with Tikit, please reach out to our support team at help@tikit.ai. To read part two in the original Power BI reporting series, find it here.
New to Tikit? Try Tikit in a 14-day free trial and schedule your free Setup call with a dedicated Tikit team member to ensure you are experiencing all that Tikit has to offer.