
When it comes to analyzing ticket data, you have a few options. You could build a sophisticated dashboard in Power BI, which would give you rich visualizations and publishing features. But sometimes, you want to stick with a trusted tool you’re used to working with for quick analysis. We’ll show you how to get set up for ticket analysis in Tikit using Microsoft Excel.
Why Use Excel?
When it comes to quick data analysis, Microsoft Excel is still a popular tool. It’s been a mainstay in the business world for more than 30 years! Excel is still a viable option because it helps you:
- Organize and format raw data so that it can be read.
- Extract actionable insights from refined data.
- Customize fields and functions to perform calculations.
- Segment and visualize data for review.
- Features like Vertical Lookup and Sorting speed up data organization.
- It offers a quick way to describe relationships.
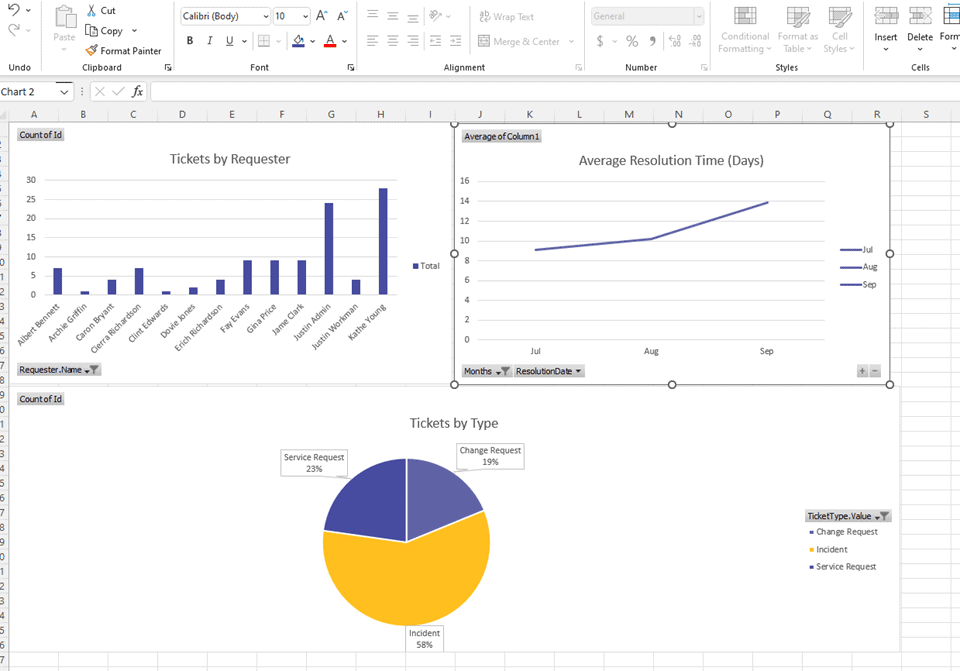
It’s not the solution for every situation, but Excel still provides a great starting point, particularly if you aren’t a pro data analyst. Here’s an example of some of the visuals you can create from data.
Connecting Microsoft Excel to Tikit
Most people who work with data in the Microsoft ecosystem bring it into Excel for some manipulation. It’s easy to connect Excel to Tikit and conduct a quick analysis, so that you can answer questions about ticket data.
There are a few benefits to connecting Excel directly to Tikit as a data source, including:
- The data is always up to date when you open the sheet or click refresh.
- You don’t have to constantly export to keep up with results.
- The spreadsheet can be shared with others, and the embedded data will remain accurate/up to date.
Here’s how to start the process.
How to Import Tikit Data into Excel
Tikit’s Microsoft 365 Service Desk edition gives you the ability to import ticket data into Excel. To do so:
1. Get an access token.
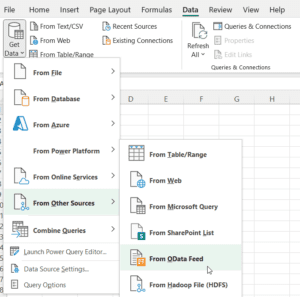
2. Open a new Excel document, go to Data -> Get Data -> From Other Sources -> From OData Feed.
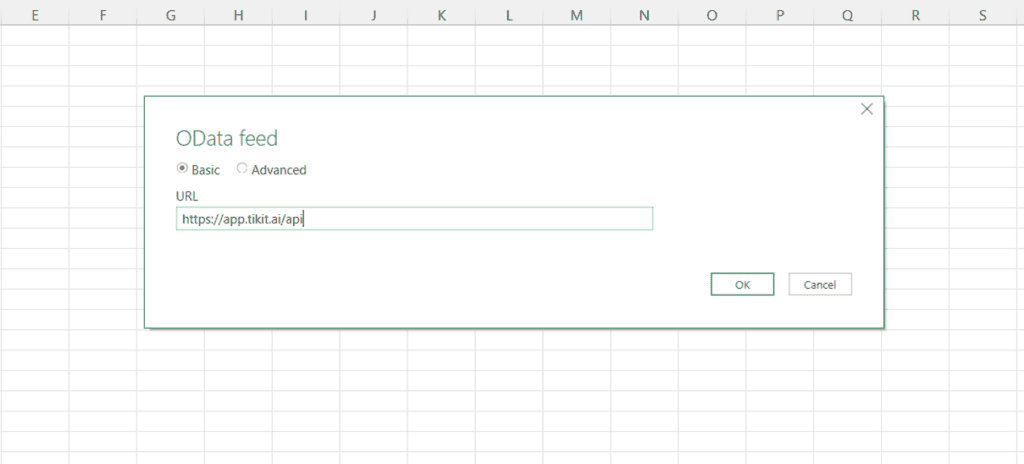
3. Enter https://app.tikit.ai/api in the OData feed URL and click OK.
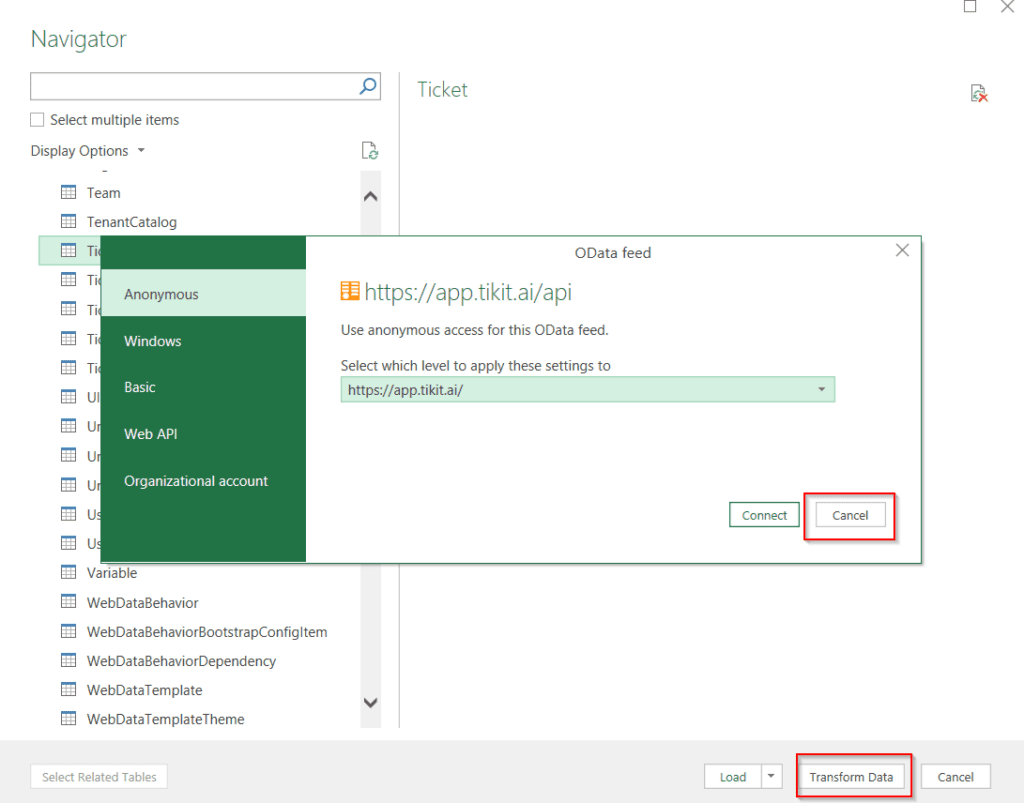
4. Scroll down the Navigator and select Ticket.
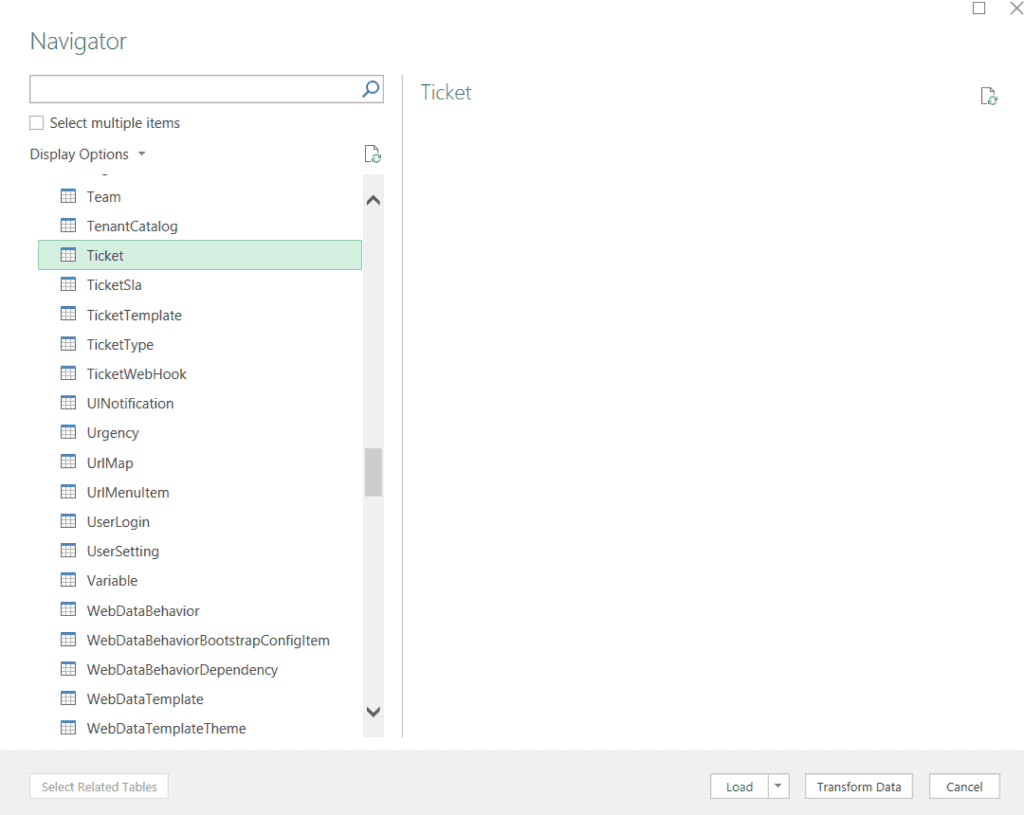
5. This action prompts Excel to reauthenticate. Click Cancel, then Transform Data.
6. Power Query will then open up. In Power Query, select Source under Applied Steps.
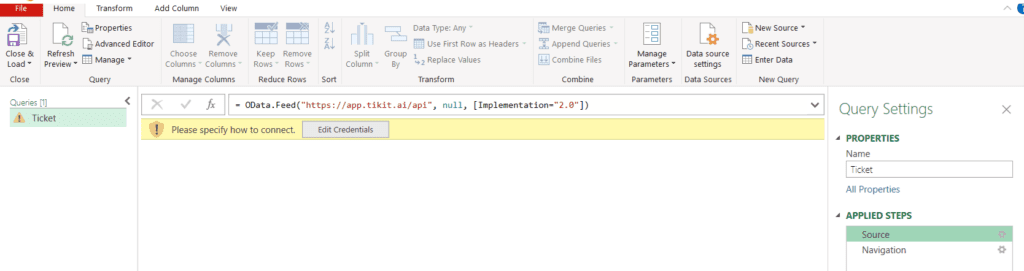
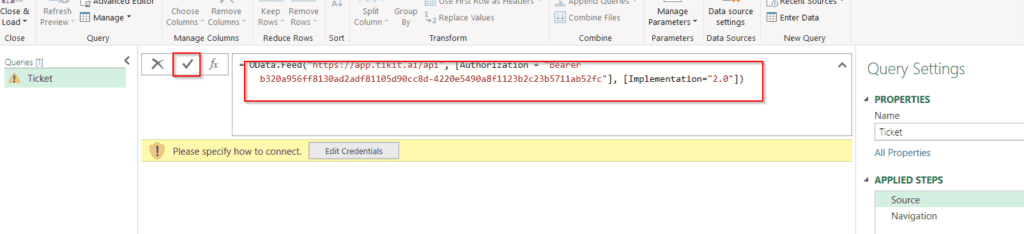
7. Replace null with [Authorization = “Bearer <your access token>”] in the top bar and click check.
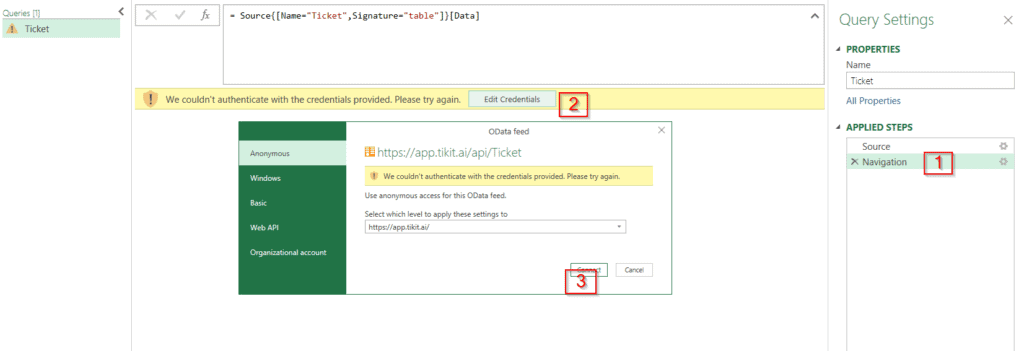
8. Go to Applied Steps > Navigation and select Edit Credentials. The authentication window will reappear. Click Connect.
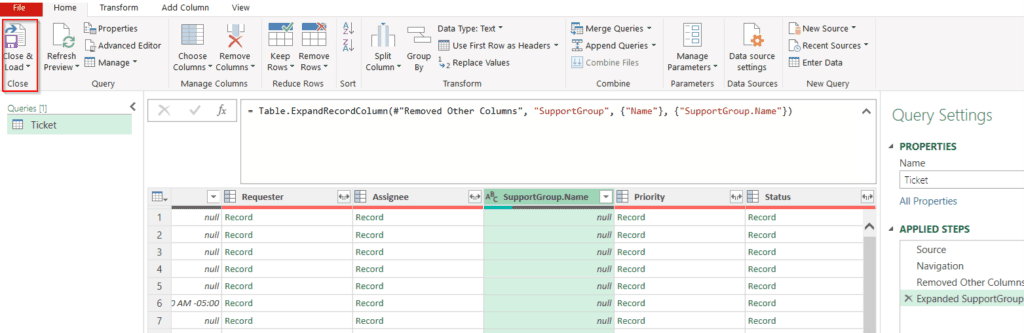
9. Select columns to appear in your Tickets view.
Note: You may want to expand Requester or Assignee fields. If so, check out Microsoft’s advice on Expanding a Record Structured column.
10. After columns are set, select Close & Load.
11. Congratulations! You can now access and analyze ticket data in Excel.
If you need a sophisticated set up with dashboards and greater data visualization, check out our analytics series How to Create a Ticketing Dashboard in Microsoft Teams using Power BI and Create Custom Dashboards with Help Desk Data. Here’s How.